
Free Preview
Colorimetric Determination of Total Phenolic Content (Smartphone Colorimetry)
The Smartphone Colorimetry Virtual Laboratory provides a simulation environment for quantifying Total Phenolic Content (TPC) in aqueous solutions and wastewater effluents. Based on the ...
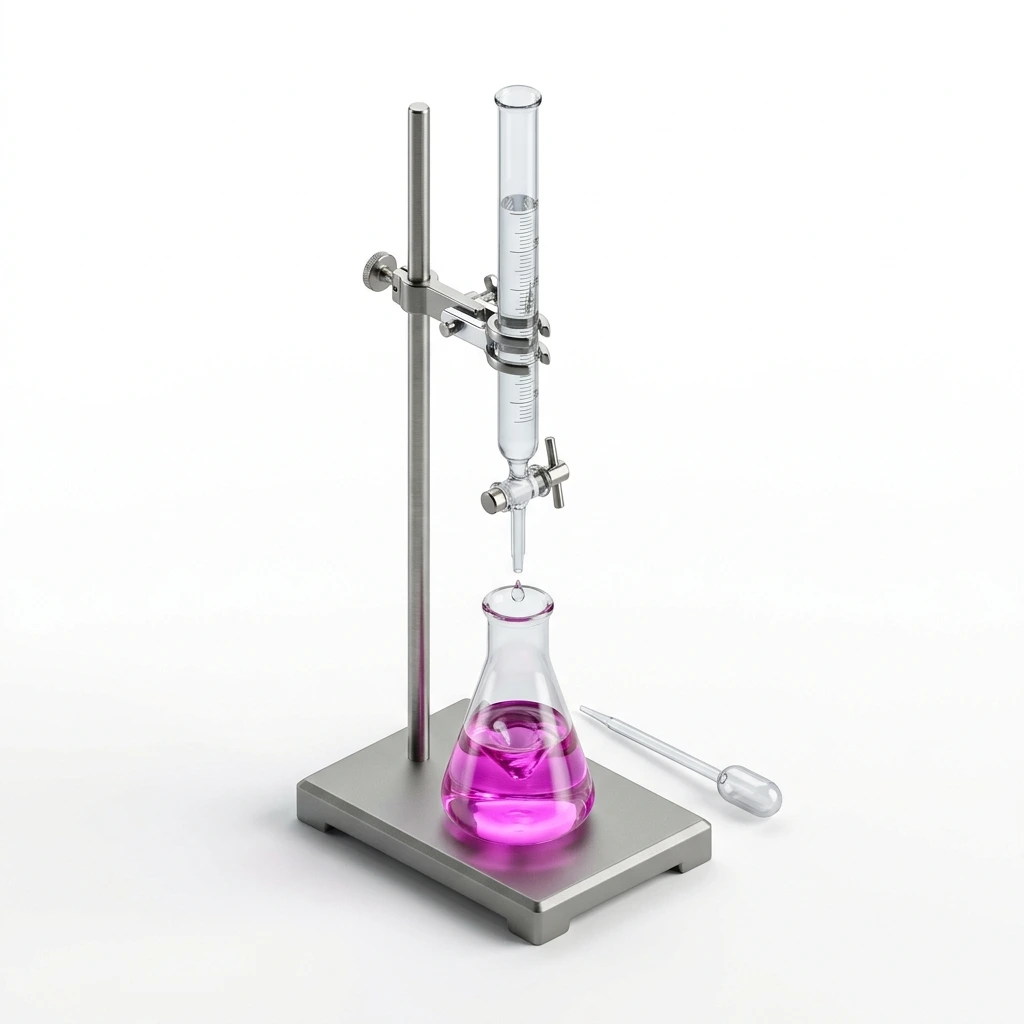
The Smartphone Colorimetry Virtual Laboratory provides a simulation environment for quantifying Total Phenolic Content (TPC) in aqueous solutions and wastewater effluents. Based on the standard Folin-Ciocalteu (FC) Spectrophotometric Method, this simulator introduces students to Digital Image Colorimetry (DIC) by utilizing a smartphone camera as an analytical detector under standardized D65 daylight illumination.Students prepare Gallic Acid calibration standards ($0\text{ to }200\text{ mg/L}$), add Folin-Ciocalteu reagent and sodium carbonate ($\text{Na}_2\text{CO}_3$) buffer, incubate the blue phosphotungstic-phosphomolybdic complex, transfer samples to standard $1\text{ cm}$ quartz cuvettes, and extract complementary Red-channel transmission values to construct calibration curves and determine phenolic concentrations in unknown samples
Redox Colorimetric Chemistry: Understand the chemical reduction of yellow Folin-Ciocalteu reagent ($\text{Mo}^{6+}/\text{W}^{6+}$) by phenolic hydroxyl groups under alkaline conditions to form a blue chromophore ($\lambda_{\max} \approx 765\text{ nm}$).Digital Image Colorimetry (DIC): Extract primary RGB color channel values (specifically complementary Red channel transmission, $I_R$) from digital camera sensor pixels to quantify absorbance.Calibration & Regression: Construct a linear calibration curve of Absorbance versus Gallic Acid Concentration and calculate the regression equation ($A = mC + b$) and correlation coefficient ($R^2$).Quantitative Assay: Determine the Total Phenolic Content of an unknown wastewater sample expressed in milligrams of Gallic Acid Equivalents per gram of sample ($\text{mg GAE/g}$).
Interactive Reaction Flask Workspace: 2D vector interface displaying $50\text{ mL}$ volumetric flasks, graduated pipettes, and animated dropwise reagent delivery.Chemical Reagents & Standards:Gallic acid standard stock solutions ($0$, $40$, $80$, $120$, $160$, and $200\text{ mg/L}$)Folin-Ciocalteu (FC) reagent ($2.5\text{ mL}$ aliquots)$7.5\%\text{ w/v}$ Sodium carbonate ($\text{Na}_2\text{CO}_3$) solution ($5.0\text{ mL}$ aliquots)Industrial wastewater unknown sampleStandard Lightbox & Smartphone Hood: Optical measurement chamber with uniform D65 daylight illumination and a $1\text{ cm}$ path-length quartz cuvette holder.RGB Color Extraction Engine: Digital CMOS sensor emulator extracting Red ($R$), Green ($G$), Blue ($B$), and total Intensity metrics.Linear Regression & Graphing Suite: Scatter plot and line-of-best-fit calculator for calibration and sample interpolation.
Step 1: Calibration Standards & Reagent AdditionSelect the Blank ($0\text{ mg/L}$) sample from the dropdown menu.Click Add Reagents & Incubate.Observation: A volumetric pipette dispenses $2.5\text{ mL}$ of Folin-Ciocalteu reagent, followed by $5.0\text{ mL}$ of $7.5\%\text{ Na}_2\text{CO}_3$ alkaline solution. A $30\text{-minute}$ incubation timer runs to develop the molybdenum-tungsten blue complex.Step 2: Cuvette Transfer & Image CaptureClick Transfer to Cuvette to load the incubated sample into the optical stage.Click Capture Image.Observation: The virtual camera captures the transmitted light under D65 illumination, extracts Red ($R$), Green ($G$), and Blue ($B$) channel intensities, and computes absorbance via $A = \log_{10}(I_0 / I_R)$.Step 3: Completing the Calibration CurveRepeat Steps 1 and 2 for Standard 1 ($40\text{ mg/L}$) through Standard 5 ($200\text{ mg/L}$).Observation: Higher phenolic concentrations yield deeper blue solutions, decreasing transmitted Red light ($I_R$) and linearly increasing absorbance ($A$) on the calibration curve.Step 4: Unknown Sample Analysis & TPC CalculationSelect Unknown Waste Water from the sample list.Perform reagent addition, incubation, cuvette transfer, and image capture.Input the extraction parameters:Extract Volume ($V$): $50\text{ mL}$Sample Mass ($m$): $1.0\text{ g}$Click Calculate Phenolic Content.Observation: The system interpolates unknown concentration $C$ from the linear regression line ($C = \frac{A - b}{m}$) and calculates the final Total Phenolic Content ($\text{mg GAE/g}$).
No figures available for this experiment.
No Interactive Simulator Available
Detailed theory, procedure steps, and AI quiz are fully accessible for this experiment.